>>
<<
Usr
Pri
JfC
LJ
Phr
Dic
Voc
!:
Help
Primer
Plot
To use the plot facility you need to load it.
load 'plot'
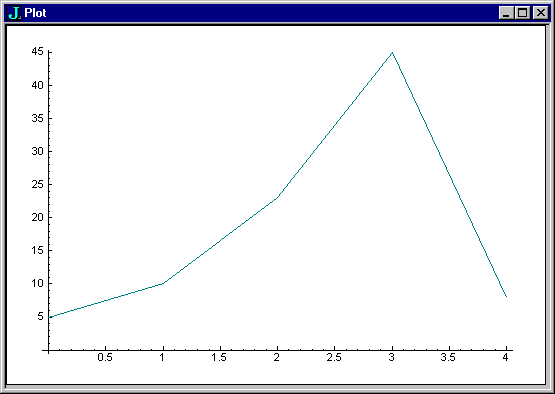
Try a simple plot.
plot 5 10 23 45 8

The plot is in a separate window. Close the plot window to get rid of it.
Now that you can plot data, let's take a look at some of the primitives you were using in the previous section.
   plot 2 ^ i. 5
   plot ? 5 $ 100
   plot ? 50 $ 100
   plot ? 100 $ 100
   plot ? 1 + i. 50
   plot ? 1 + i. 100
A left argument customizes the plot.
'TITLE myplot;TYPE bar' plot 2 ^ i. 5
Or try the sine values you calculated earlier.
plot 1 o. i. 16
There is a family of utilities defined in script trig.ijs you could make use of here. Use load to load that script.
   load 'trig'
   plot sin i. 16
To produce a finer plot you need to provide more results over a similar range.
   plot sin 0.2 * i.60
   plot cos 0.2 * i.60
>>
<<
Usr
Pri
JfC
LJ
Phr
Dic
Voc
!:
Help
Primer
